A Beginner's Guide to Continuous Integration in Python
Imagine this: you're working on a Python project, and you're annoyed that each time you create a new merge (or pull) request, you must remember to run tests. Or maybe you configured your code editor to run black each time you save a file, but your colleagues didn't. Every time you touch a file after them, you end up formatting random parts of the code. This makes code reviews harder because the reviewer doesn't know which lines of code you actually changed and which were only automatically reformatted.
If those types of frustrations sound familiar, it means you need continuous integration!
This is a written guide from the "CI 101: A Beginner's Guide to Continuous Integration" talk that I presented at PyConPL this year.
What is continuous integration?
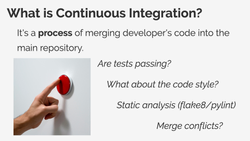
Continuous integration, or CI for short, is a process of merging a developer's code into the main repository. Each time you write a new feature, your code has to be added to the existing code and combined with the code written by your colleagues.
It sounds as easy as pressing a button, but there is more you need to do:
- You need to make sure your code works properly, so you must run your tests first.
- You need to make sure your code matches the formatting standards adopted by your team, so you need to run it through a code formatter like black or a similar tool.
- You probably also need to run some other static analysis tools like flake8 or pylint that will check your code.
- Finally, multiple people might be working on the same part of the code, so you need to resolve some potential merge conflicts and ensure everything still works with both the changes from you and your colleagues.
A lot of these tasks can be automated. Let's say that each time you merge code to the master branch, you need to create a release package or build and push a new Docker image. Or you need to publish a new version of the documentation for your project. There is absolutely no point in doing this manually if you can easily write some scripts that create release packages, build and push Docker images to some repository, or rebuild your project documentation (of course, only if all the automated checks are passing).
Why do we need continuous integration?
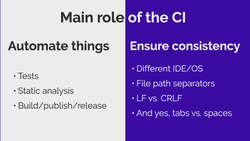
The main role of the CI system is twofold.
First of all, you should use it to automate all those repetitive tasks in your work. CI should:
- Run tests and display the summary of the results.
- Run static analyses and inform you about possible violations.
- Build and publish Docker images, documentation pages, release packages, etc.
But continuous integration is also a means to ensure consistency in your project.
People use different development setups, IDEs, and operating systems, and all those factors affect the code they produce. Your colleague who's using Windows writes a new feature with 100% test coverage, but it doesn't matter because he uses backslashes in file paths, and the moment this code lands on a Linux machine, it no longer works (unless you use a library like pathlib that is smart about the file paths). Another colleague may have a misconfigured code editor and uses tabs instead of spaces. When you review their merge request (a merge request is GitLab's equivalent of a pull request in GitHub), every line in all the files they touched is marked as modified because everyone else uses spaces.
Some people set all their formatters, linters, and other tools to fix things automatically. And some people don't. This will make your codebase full of different code styles, unused variables, duplicated imports, and so on. You can chase those people and ask them over and over again to fix things with their development setup because if you don't, your code reviews can become full of silly nitpicks like "add docstrings", "sort imports", or "this line is too long". And let's not forget that this process will repeat each time a new developer joins your team.
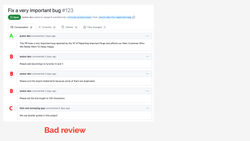
Alternatively, you can configure automatic tools that fix or at least point out all those obvious issues.
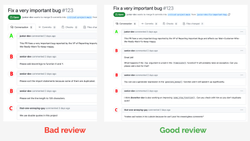
Look, your code reviews should focus on high-level feedback, like discussing the design of a feature or suggesting additional test cases for some corner-case bugs. They should not focus on code style or unused variables. All those simple things that can be detected and reported by automatic tools should be detected and reported by automatic tools.
Choosing a CI platform
I hope I convinced you that CI is a useful tool to have. But which CI platform to choose? Luckily, nowadays, both Gitlab and Github come with a built-in continuous integration tool. Plus, there are other commercial solutions if you want something specific. And, of course, there are open-source solutions like Jenkins.
There are plenty of options, and if you don't know where to start, I suggest using this simple decision tree:
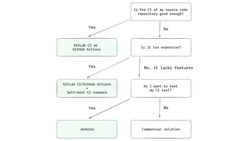
If you don't know what to choose or don't have any preference, start with either Gitlab CI or Github actions, depending on which distributed source control platform you use. Both solutions are good enough for small projects with low costs or for bigger projects that don't care about the cost of build minutes.
When the cost of the build minutes starts to pile up, you can self-host the CI runners. You set up a server that will run the jobs from CI, and that way, you won't be using your computing credits. At the same time, all the results of the runs will still be displayed in GitLab/Github, so maintaining this setup won't be too time-consuming.
If, on the other hand, it's not about the costs, but you find that GitLab CI or GitHub actions are missing some features, then you have to ask yourself - "Do I want to host and maintain my own CI tool or do I prefer to pay for a commercial solution?" Suppose you have time to maintain your own CI installation. In that case, Jenkins is a de facto open-source CI platform that is very extensible with all the plugins and configuration options. It's a good choice used in many large organizations. On the other hand, if you don't want to spend time maintaining a Jenkins server, just use one of the existing commercial solutions with the features you find important.
Your first CI pipeline
Let's try to build a simple CI pipeline. What's a "pipeline", you ask? OK, let's maybe start by explaining the basic concepts in the CI terminology:
When talking about CI, you will often hear about these three terms:
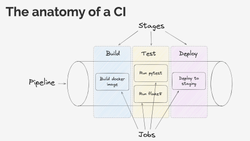
- Pipeline - that's the whole process that runs on your code. It prepares the environment (for example, by pulling a container where all the commands will run, setting some environment variables, etc.), runs all the tasks you defined in your CI configuration, and prints the results. When that process is complete, the pipeline has a status of either "successful" (so everything is fine with your code) or "failed" (indicating that there were issues that you need to fix). Pipelines often consist of multiple stages to easily manage and group together different jobs. If one of the jobs that are required to pass fails, the execution of the pipeline stops, and the pipeline is marked as "failed".
- Stages - these are collections of jobs. For example, you can have a "build" stage where you build Docker images that will be used later in the pipeline. Or you can have a "test" stage where you run tests, static analyses, and all the other tools that can detect if there is something wrong with your code. Often, when talking about continuous integration, another term you will hear about is continuous delivery (CD) - this means that if your pipeline is successful, your code is automatically deployed to a server. So, the last stage in our pipeline could be responsible for deploying the code to a "staging" or "production" server, provided that no issues were detected with our code in the earlier stages.
- Jobs - these consist of one or more commands to be executed. A job can be as simple as running a
pytestcommand. Usually, commands in a job are equivalent to shell commands. So, whatever you normally type in the terminal to build the docker image or run tests, the CI job does automatically for you.
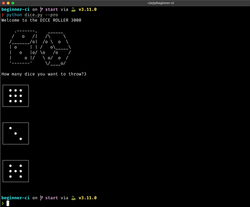
Now that we have a common understanding of the CI terms I will be using, let's build our first CI pipeline. For that, I will need some Python code on which I can run tests or static analysis tools. So, I've created a demo project that consists of a simple dice-rolling program: https://gitlab.com/switowski/python-ci-101/-/tree/start.
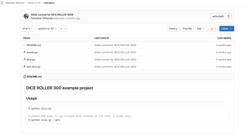
It has a twist, though. You can pass a --pro flag and use 9-sided dice instead of regular 6-sided ones. You can use the flag for your board game sessions and allow some players to pay and get an unfair advantage over the non-paying players. It will, of course, completely ruin the game experience for non-paying players, which is exactly what happens in most free-to-play video games. So, I think this is a good, real-life example 😉.
Let's create a simple pipeline for this project.
Since my code is hosted on GitLab, I will be using GitLab CI, and my CI configuration will live in a file called .gitlab-ci.yaml. GitLab CI pipelines (and most of the CI solutions) run in Docker containers, so often, the first parameter we define in our configuration is the base image. This image is the Docker container that will be used in all the jobs (unless a job specifies a different image), and it's always a good idea to specify it explicitly. If you don't define what image you want to use, you will probably get some default ruby Docker image. And while your CI might work just fine, at some point, you may run into some hard-to-debug issues when the default image changes and your pipeline suddenly starts failing.
# .gitlab-ci.yml

image: python:3.11-slim-bullseye
For my pipeline, I've decided to use Python 3.11 on a slim-bullseye distribution. "Bullseye" is a name of a Debian release, and "slim" means that this Docker image is smaller than a default Debian Bullseye image. It has less software installed, but in most cases, it has everything we need to run pip install. At the same time, it's much smaller than the full Debian image ("3.11-bullseye" has around 340MB while "3-11-slim-bullseye" has around 46MB), so it's faster to download it in your CI pipeline (and this in turn will make your pipelines finish faster).
As a rule of thumb, if you don't know Docker or have no specific preference for the Python version or Linux distribution, using the latest stable Python version on a slim, Debian-based distribution is a good choice.
Test job
Once we have the image selected, we can define our first job. Since I have a test file in my repository, the obvious candidate is a job that runs tests:
image: python:3.11-slim-bullseye

test:
  script:
    - pip install pytest
    - pytest .
We've added a job called "test", where we defined two shell commands. First, we install the pytest module, and then we run the pytest command.
Code formatting job
What else can we add? We can check the code style to make sure our code follows the PEP 8 guidelines. There are plenty of different tools to choose from. If we want something that works out of the box, we can use black. If we want a tool that supports more configuration options or a different set of default settings, we can use blue or one of many other Python formatters with different configurability levels.
I will go with black, and later, I will adjust the line length in our project because I like to use 120 characters.
image: python:3.11-slim-bullseye

test:
  script:
    - pip install pytest
    - pytest .

black:
  image: registry.gitlab.com/pipeline-components/black:latest
  script:
    - black --check --diff .
The "black" job is running the black command with options to only check the code (without trying to reformat it) and print the difference between how the code looks now and how black would change it. Don't worry about this image definition in the black job for now. I will explain it once we add one last job to our pipeline.
When I saw the above "black" job for the first time, I immediately asked myself, "Hey, why aren't we reformatting the code in CI instead of just reporting problems?" Theoretically, that makes a lot of sense. Why do we have to spend time fixing the code formatting and submitting another commit to the repo? Instead, we could run black in CI, have it reformat the code, and submit a commit with the fix on our behalf. But which user should be the author of that new commit? And what should be the commit message? Tools like black can't create new commits in the repository out of the box. You would need to configure some access tokens with write access to the repository and write a script that takes the output of black and pushes a new commit.
All that is doable but requires additional work (or some kind of a bot that can do this for you). And not everyone wants this kind of setup. If black reformats the code in your branch on Gitlab, you need to pull those changes to your computer, which might cause merge conflicts if you have already started working on additional changes on your local branch. This and the fact that the vast majority of people run black or some other code formatting tool automatically when they save the file in their code editor means that it's fine for black to only report the problems in CI. That's enough to indicate that someone on your team needs to fix their editor's config and make sure they format the code automatically.
Later, I will talk more about dealing with consistent code formatting in your team.
Linter job
Great, we're running tests and checking if the code formatting is consistent with the PEP 8 recommendations. That's already a great start, but there is another job that is very common in CI pipelines - running a static analysis tool. Static analysis tools will report errors with your code, like undefined variables, unused modules, code that can't be reached, missing parameters in a function, and all those bugs that can be detected without actually running your code (thus the name static analysis). We can use many different tools, both open-source and commercial ones. The three most popular open-source ones are flake8, pylint, and the new kid on the block - ruff.
I will go with flake8 because that's the tool that I'm most used to[1]:
image: python:3.11-slim-bullseye

test:
  script:
    - pip install pytest
    - pytest .

black:
  image: registry.gitlab.com/pipeline-components/black:latest
  script:
    - black --check --diff .

flake8:
  allow_failure: true
  image: registry.gitlab.com/pipeline-components/flake8:0.11.2
  script:
    - flake8 --verbose .
And with that, our CI pipeline is finished!
One thing that is different in "flake8" jobs compared to other jobs is the allow_failure: true option. This means that even if the job fails, the whole pipeline continues running, and you only see a yellow exclamation mark in the pipeline results. Unlike with tests (where a failing test usually means a problem with the code that should be checked right away), I don't want my whole pipeline to fail if I have some linter violations. If I see the warning and have some time, I can fix the problem in the same merge request. But if I'm in a hurry, I can fix it in the next merge request, and it's not really a big deal.
The same rule should apply when using black - bad formatting of your code has absolutely no impact on how this code works, so it's not a showstopper for the next deployment. But, first of all, black should run automatically on your computer. When you save a file in your editor, the file is automatically reformatted, and you don't have to do anything. So, it's different than fixing errors from flake8, where you're required to manually fix things because linters won't change your code in any way. Once everyone on your team configures their code editors properly, you will probably never see black failing again.
Another reason why black is not marked as "allowed to fail" is that, for illustration purposes, I wanted to have a failing pipeline. That way, we can see what a failing pipeline looks like and have something to fix.
pipeline-components
Before we wrap up our initial CI setup, there is one more thing I want to explain. What's the deal with those image: registry.gitlab.com/pipeline-components/... lines? For both "black" and "flake8" jobs, I'm using a Docker image from the gitlab.com/pipeline-components repository. This repository stores docker images of various linters, formatters, and other static analysis tools that can be used in CI pipelines.

Of course, we could use black and flake8 in the exact same way as we did with pytest:
image: python:3.11-slim-bullseye

test:
  script:
    - pip install pytest
    - pytest .

black:
-image: registry.gitlab.com/pipeline-components/black:latest
  script:
+   - pip install black
    - black --check --diff .

flake8:
  allow_failure: true
-image: registry.gitlab.com/pipeline-components/flake8:0.11.2
  script:
+   - pip install flake8
    - flake8 --verbose .
So, using the default slim-bullseye image, we run pip install black or pip install flake8 and then the remaining commands. The main reason to use the pipeline-components is that they will be slightly faster because these docker images are designed to be small and fast (as their GitLab description says). But the difference is rather tiny (maybe a few seconds of a build time), so don't worry if you're using a different way of installing static analysis tools.
Also, notice that we are using the "latest" tag for black's pipelines-component image, but we use the "0.11.2" tag for flake8's image[2]. Using a specific tag is useful when you want more control over which version of a tool you're using instead of always using the latest released version. The latest version for the black tool means "23.7.0" today, but it can mean "23.8.0" tomorrow and "35.1.3" in a year. Each time the "latest" version changes, it might work differently than before and suddenly start failing your CI jobs. It's frustrating to start your day by debugging a failing CI pipeline that worked just fine yesterday, but now it fails even though you haven't touched anything.
Another reason to use specific tags is that you should run the same versions of packages in your CI as you use on your local computer. Let's say that on your computer, you have a specific version of flake8, and you don't upgrade that version regularly because everyone in your team is using that version[3]. If CI uses a different version, it might start reporting different problems than your local version. So running static analysis on your computer will report no problem, but running it in the CI will fail because a newer version of a given tool has some new checks that suddenly start failing.
Why did I use "latest" for black and "0.11.2" for flake8 pipeline-components? Only for illustration purposes to show you both possibilities. Normally, I would always use a specific tag for every image in my CI configuration.
The final version of the initial pipeline
With our initial setup finished, let's have a look at the complete content of the .gitlab-ci.yml file:
image: python:3.11-slim-bullseye

test:
  script:
    - pip install pytest
    - pytest .

black:
  image: registry.gitlab.com/pipeline-components/black:latest
  script:
    - black --check --diff .

flake8:
  allow_failure: true
  image: registry.gitlab.com/pipeline-components/flake8:0.11.2
  script:
    - flake8 --verbose .
If we push this code to the GitLab repository, GitLab CI will automatically detect this configuration and run a pipeline for us.
Which will fail.
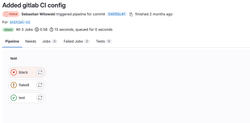
That's because I intentionally didn't run black on my code when I first wrote it, nor did I pay attention to the code style. Once I added black to my pipeline, it immediately started complaining about my code.
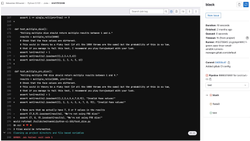
We can click the failed "black" job to see the full log and all the places where black detects wrongly formatted code.
You can also see that the "flake8" job has a yellow exclamation mark. It means that this job also failed, but we allowed it to fail (remember the allow_failure: true setting?). An optional job like this one is useful to indicate problems that should not immediately block the deployment of your code but that you should address at some point. The world doesn't end if you leave an unused variable in the code, but cleaning it up one day will make the maintenance of your code easier.
Just like with black, we can click the failed "flake8" job and see the full log:
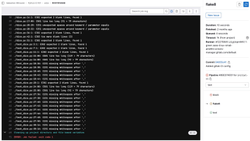
flake8 is not happy about missing whitespaces and lines that are too long. Luckily, these errors will be fixed when we run black on our codebase. But before we do that, I want to increase the maximum line length to 120 characters. That's totally a personal preference, but I (and I bet you too) have a screen large enough to display more than the 79 characters in one row that black enforces by default.
Unfortunately, both black and flake8 use separate configuration files. Even though they accept multiple configuration formats like tox.ini, setup.cfg, pyproject.toml, etc., as of today, there is no one, single configuration file that works for both. To change the maximum line length in black and flake8, I need to write two configuration files:
# pyproject.toml
[tool.black]
line-length = 120
# setup.cfg
[flake8]
max-line-length = 120If we add these two files to the repository, run black on our code, and push all that to our repository, we can see that the pipeline is now passing, and all jobs are green:
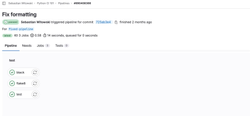
Great! We now have a simple GitLab CI pipeline that runs tests, checks code formatting, and even reports static code violations. This pipeline is really all you need for many small Python projects.
Extending our CI pipeline
What else can we put into our CI?
Honestly, the sky (and common sense) is the limit:
- If you like type hints, we can add type checkers like mypy. A type checker notifies us if the declared types of variables don't match the types that are actually used in the code.
- We can add tools like bandit that check our code for some common security vulnerabilities.
- We can add tools like vulture that try to detect unused code we can remove.
- If it turns out that maintaining all those separate tools is too much work, we can just plug in something like prospector that combines different linters together.
- Slack notifications about failed pipelines? Sure. Deployment to a test server? Why not? Automated bots? Go for it!
- Finally, let's not forget about a whole separate world of commercial tools that give us even more feedback about our code.
Many of those tools can be further enhanced by installing additional plugins. A good example is flake8, which is often installed with plugins that add additional checks. Another example is pytest, where additional plugins can add new functionality like displaying test coverage of your code, running tests in parallel, and more.
We're not going to implement all those different tools in our CI, but let me show you another very useful feature. We will display the test coverage of our code. This will make it easier to see if a merge request increases or decreases the total test coverage in our project. It's also a good way to show you some more advanced topics, like using artifacts to preserve files between jobs.
Displaying the test coverage
Here is what our test job currently looks like:
test:
  script:
    - pip install pytest
    - pytest .
Let's extend it to also include the pytest-cov plugin and to display the test coverage:
# Source: https://docs.gitlab.com/ee/ci/testing/test_coverage_visualization.html#python-example
test:
script:
- pip install pytest pytest-cov
- pytest --cov --cov-report term --cov-report xml:coverage.xml
coverage: '/(?i)total.*? (100(?:\.0+)?\%|[1-9]?\d(?:\.\d+)?\%)$/'
artifacts:
reports:
coverage_report:
coverage_format: cobertura
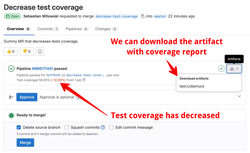
path: coverage.xmlThat is definitely not a trivial change! First, we installed the pytest-cov package. Then, we defined the coverage key with a complex regular expression to extract the total test coverage percentage from the "test" job. Finally, we defined an artifact that will create a coverage report in a specific format that GitLab can use ("cobertura"). This coverage.xml file contains a report with annotations for every line of your code. GitLab can use it to display which lines of your code are covered by tests and which are not.
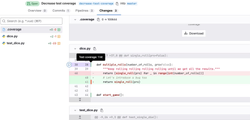
Artifacts are one of the ways to share files between jobs. By default, every job runs in a separate container, and that container is deleted when the job is finished. So, any files created in a job - like the coverage.xml report file in this case - will also be deleted once the test job is completed. However, when we define an artifact, GitLab preserves that file and makes it available for other jobs or for downloading. In our case, we want to keep the coverage.xml file after the test job is completed so that GitLab can use this file to annotate which lines in our code are covered by tests.
In case you're wondering how I knew how to write all those lines in the .gitlab-ci.yaml file to display the test coverage - I just googled it. If you type "gitlab pytest coverage", the first result contains the documentation page from where you can copy all the code I used. Unless you work as a DevOps engineer and write CI configuration files all the time, your experience will probably be the same as mine - you will look up different things, apply them, and hope they will work. And quite often, they will. At least for GitLab, the documentation is pretty good, and all the code examples are usually up to date.
That concludes our GitLab CI setup. You can find all the code in the test-coverage branch on GitLab. You can take it and extend it with other tools you want to use in your project. Just keep in mind that with each new tool you add, your pipelines will get slower. You need to find a balance between having enough feedback from your tools so you detect most of the potential issues and having your pipelines finish in a reasonable amount of time. Sometimes, you can get away with a much simpler setup.
Do I always need CI?
If that was the first time you were setting up continuous integration, you may feel overwhelmed. Writing this YAML configuration file was so much different than writing Python code. And if something goes wrong, debugging can also be challenging.
Sometimes, running linters on your computer is enough. For example - when you're working on your own project without a need to collaborate with anyone else, but you still want to write nice, consistent code and get feedback from the linters.
In this case, you have two main choices. The first one is to configure all those linters and checkers in your IDE, probably through some plugins. However, I assume we all know how to configure our code editors, so let's focus on the second option - using the pre-commit tool.
pre-commit
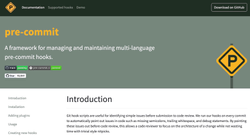
pre-commit is a tool that installs a git hook. More specifically, it installs a pre-commit git hook; that's why the tool is named like that. A pre-commit hook is a script that is executed before you create a new commit. So, each time you try to create a new commit, git runs this script, and if it fails, git prevents you from creating the commit.
All the configuration happens through the .pre-commit-config.yaml file, where we can define different checks and linters we want to run. Let's see an example:
# .pre-commit-config.yaml

default_language_version:
  python: python3.11

repos:
  - repo: https://github.com/pre-commit/pre-commit-hooks
    rev: 23.3.0
    hooks:
      - id: check-merge-conflict
      - id: check-toml
      - id: check-yaml
      - id: end-of-file-fixer
      - id: trailing-whitespace
  - repo: https://github.com/psf/black
    rev: 'refs/tags/23.3.0:refs/tags/23.3.0'
    hooks:
      - id: black
        alias: autoformat
  - repo: https://github.com/pycqa/flake8
    rev: 6.0.0
    hooks:
    -   id: flake8
We start by enabling some checks that come directly with the pre-commit tool. They will check for leftovers from resolving merge conflicts (e.g., "<<<<<<<" left in your code), validate TOML and YAML files, ensure that files end with a new line, and remove any trailing whitespaces. We also specify two external plugins - black and flake8, which are the same plugins that we have in our CI.
Now, we need to install the pre-commit tool (using pip, brew, or any other tool you prefer) and enable the git hook with the pre-commit install command. If everything works fine, when we try to create a new commit, pre-commit will automatically run all the checks on the modified code:
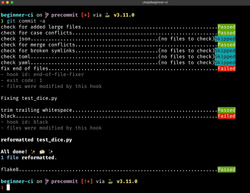
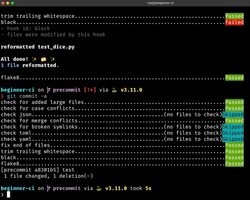
The nice thing about pre-commit is that it tries to fix whatever can be fixed automatically. So, in most cases, when you run git commit for the first time, and there are some easy-to-fix errors, pre-commit will complain but at the same time fix the errors. Then, when you run git commit for the second time, it should work fine:
Pros and cons of local checks
Using pre-commit (or any other tool that runs checks locally) means you can move some checks from CI to your computer. This reduces the cost of your CI and is faster. Running black or flake8 in CI takes at least a couple of seconds because we need to install those tools in a CI container or download the correct Docker image. On the other hand, running all those pre-commit hooks in my example project takes less than 1 second. And even for large projects, if you use a tool like ruff, you can easily keep your pre-commit checks under a second.
pre-commit is a great tool if you get everyone in your project to install and use it, which can sometimes be problematic. Some people might run into issues while setting up pre-commit on their computers, and some can't even be bothered to install it at all. If you work alone or in a small team, that's usually not a problem. But if you have to chase people over and over again and ask them to use pre-commit, just don't bother and use CI.
If you need more help choosing between pre-commit and CI, check out my pre-commit vs. CI article.
Do we have to choose between using pre-commit and setting up CI? No. Quite often, the best results can be obtained by combining both tools together.
Three steps for a solid CI setup
Here is a setup that I suggest using.
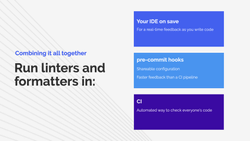
First, if you know how to do this, configure your IDE to run all possible checks and formatters either in real time or whenever you save a file. This should run asynchronously, which means it won't block you from typing and, at the same time, it will show you errors and warnings as you write your code so you can fix them right away.
Set up pre-commit hooks if some plugins can't be used in your IDE or if you want to make sharing the configuration with your teammates easier. Hooks will give you feedback before you push your code to CI, so you won't be unnecessarily running pipelines that will fail for very obvious reasons like unformatted code.
Finally, use CI to have an automated way of checking everyone's code. That way, you don't have to chase people to fix their pre-commit setup. If their code doesn't match the standards you have established in your project, that's a problem they need to go and fix. For faster feedback, I suggest running linters and formatters in parallel to running tests (but optimizing your existing pipelines is a topic for another article).
I hope that with this article, I convinced at least some of you that continuous integration can be a great tool to automate some boring and repetitive tasks and help you focus on important stuff. What I showed you here should help you build your first CI pipelines.
In the future, I will publish another article covering topics from my Optimizing Your CI Pipelines presentation. I will explain what to do when our pipelines get slow and complex, so stay tuned.
I know I should switch to ruff as everyone else did, but I have a bunch of old projects where flake8 is good enough. ↩︎
Please note that 0.11.2 doesn't mean we are using version 0.11.2 of flake8. It means we are using version 0.11.2 of the
pipeline-components/flake8image, and the flake8 version defined there is actually 6.0.0. So, versions of images in pipeline-components don't correspond 1-to-1 with the versions of their underlying static analysis packages. ↩︎Having a CI setup that just works and not changing it for months is another trap you can fall into. If you don't upgrade the versions of your packages, you're not going to take advantage of new features or performance improvements. Not to mention all the security patches and bug fixes that were added in new versions. Of course, it's much better to use old tools that cause you no problems than to use the "latest" version and constantly adjust tests and your configuration to accommodate changes in those packages. But the best solution lies somewhere in the middle. It's a combination of updating your tools from time to time but in a controlled manner. ↩︎